Monte Carlo stock simulator

It promised 50%.
It hit 73%.

10,000 simulated months for the S&P 500, from two engines. Then an exam at 179 past dates: does the “50%” band really catch reality half the time? The textbook bell curve caught it 73% of the time. Real 21-day blocks caught 54%, within luck.

Native app, 0.8 MB, notarized by Apple, macOS 26. Also for iPhone via TestFlight, soon.

0 / 10,000 paths lands in the 50% band in the 90% band outside GBM with SPY's calibrated μ 13.8%, σ 17.1%, drawn live in your browser

Watch first

The whole idea in a hand-drawn film

A Monte Carlo cone is a forecast you can grade, like a weather forecaster: not on one day, but on whether it rains 70% of the times they say “70%”.

1:41, narrated in Spanish. Sound plays when you press play.

Narrated in Spanish · 1:41 · hand-drawn explainer

Two engines

Engine 1: the bell curve

Geometric Brownian motion, the model under Black–Scholes. Every day is a draw from one bell curve, calibrated on the last 5 years of SPY.

ST = S0 · exp( (μ − ½σ2)T + σ√T · Z ),  Z ~ N(0,1)
13.8%μ, a year
17.1%σ, a year
21trading days

10,000 paths. Median after a month: $777.71. Chance of a gain: 58.2%.
Two engines

Engine 2: real 21-day blocks

The block bootstrap assumes no shape at all. It cuts the last 5 years into real 21-day pieces and resamples them with replacement.

future = blocki,  i ~ Uniform{ 1 … 1,260 − 21 }

Crashes come back, and in clusters, because a block keeps its neighbours. Median after a month: $781.97. Chance of a gain: 65.7%.

Two engines

Same size of risk

Drop all 10,000 endpoints into a histogram. Both engines agree on how bad a bad month is.

6.9% · 7.2%95% VaR, one month
8.7% · 8.9%expected shortfall

A VaR backtest alone would call them equal. The difference is in the shape.

Why the shapes differ

Markets are not a bell curve

5,026 real SPY days since October 2006, measured in standard deviations. A normal distribution allows 0.3 days beyond ±4σ. There were 38. Worst day: −10.9%.

Excess kurtosis 14.1: most days are calmer than the bell curve says, and a few are far wilder. So GBM's middle bands come out too wide.

The exam

179 past months, one question

Once a month from October 2011 to August 2026: calibrate on the 1,260 days before, simulate, then mark where the real price landed inside the simulated distribution (its PIT, a number from 0 to 1).

An honest model spreads the 179 dots evenly, about 18 per column. GBM piles them in the middle. The bootstrap stays flat.

The exam

Graded: GBM fails, the bootstrap passes

Share of real outcomes inside the central band. With 179 tests, luck alone moves this by about ±7 points at 50% and ±4.4 at 90% (the grey zone).

GBM: 73% and 96%, both outside the noise. Bootstrap: 54% and 91%, inside it.

Not cherry-picked: rerun on 16 stocks

US, Spanish and UK stocks and ETFs, 1-month horizon, with the two tests a risk team asks for: Kupiec (the Basel VaR backtest) and Kolmogorov–Smirnov on the whole distribution.

16 stocks pooled, p < 0.05 counts as a fail
EngineInside 50% bandInside 90% bandVaR 95% breachesKupiec failsKS fails
GBM61.9%93.6%3.5%1 / 168 / 16
Block bootstrap51.6%89.7%4.9%0 / 160 / 16

GBM passes the VaR test on 15 of 16 and fails the shape test on half. Checking one quantile is not enough. The pooled figures overlap in time across stocks, so read them as a summary, not as 2,877 independent tests.

Four stocks in detail, about 180 independent monthly tests each
TickerHistoryGBM, 50% bandBootstrap, 50% bandGBM, 90% bandBootstrap, 90% band
SPY2006–202673%54%96%91%
AAPL2006–202656%52%95%91%
KO2006–202660%46%93%90%
ITX.MC2006–202657%50%93%89%

Where it breaks

The checks pass: simulated GBM matches its closed-form lognormal within sampling error, the exam scores about 90% on data that really is a bell curve, and an independent review found no look-ahead. These are the limits it does not hide.

It doesn't forecast direction

μ is the 5-year mean return, which is mostly noise. The width of the cone is the information.

Volatility is constant in each run

After a crash it isn't. Modelling that is GARCH, a separate Quantum project.

Survivorship bias

Only stocks that still trade can be examined.

Long horizons have little power

15 years of test dates hold only about 14 non-overlapping years, so the demo says so at 1 year instead of drawing conclusions.

Run it on any stock, on your Mac

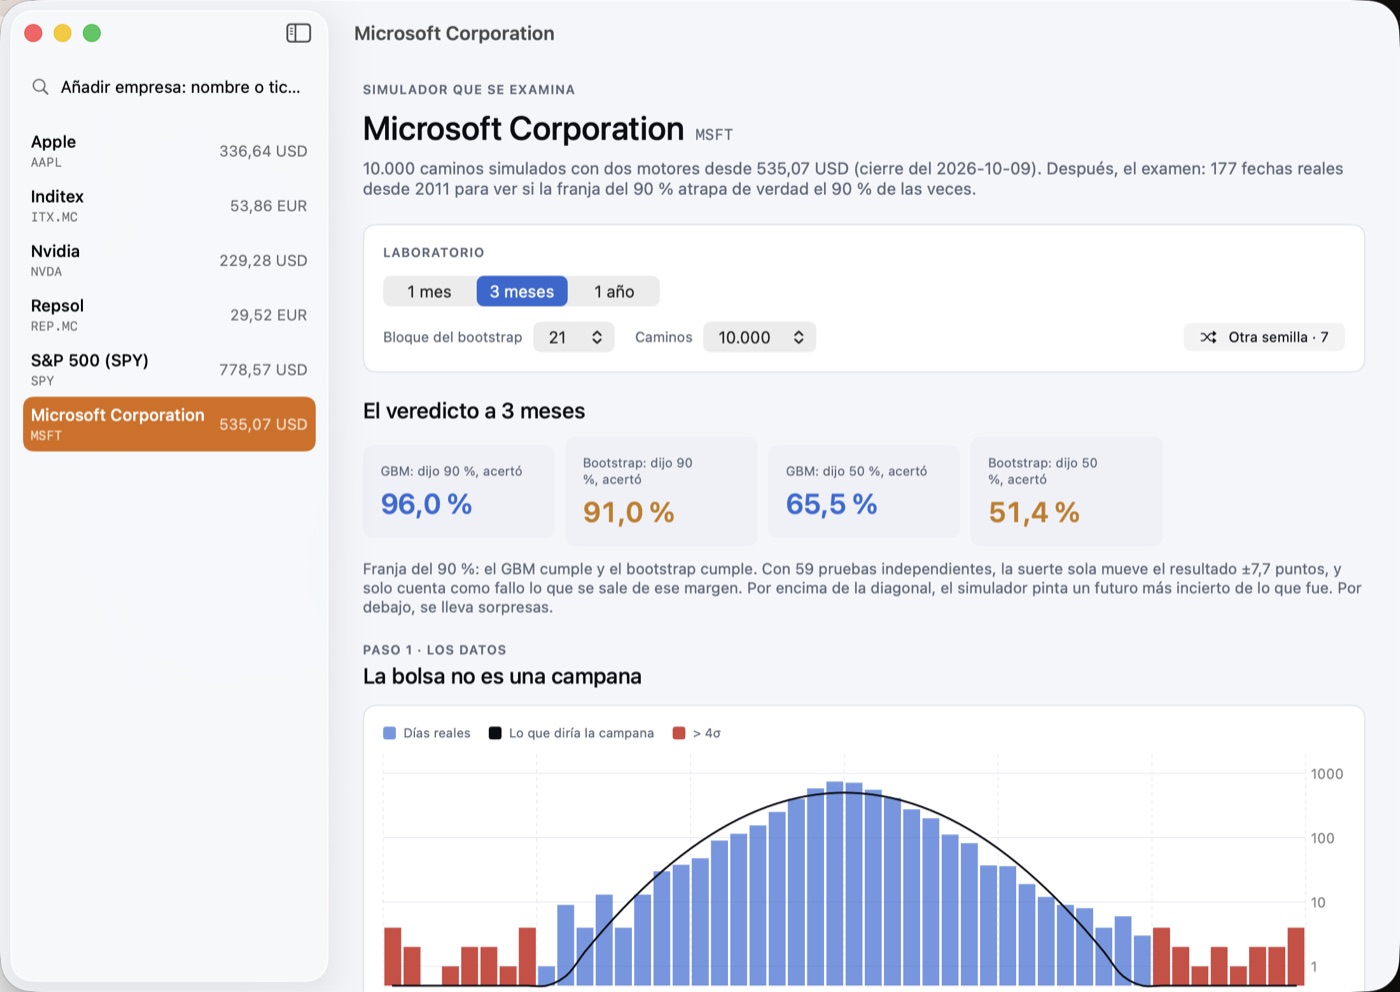
The same two engines and the same exam, as a native app. Five stocks come built in; type any company name and it pulls the prices from Yahoo Finance and runs the 10,000 paths on your Mac. Spanish or English, after your system.

0.8 MB installer, signed with a Developer ID and notarized by Apple: double-click and it lands in Applications. Needs macOS 26. iPhone version coming through TestFlight; the Python version runs anywhere with python3 server.py.

The Mac app: a sidebar with Apple, Inditex, Nvidia, Repsol, SPY and a searched Microsoft; the lab with horizon, block and path controls; the 3-month verdict cards and the first chart